ROLE
Founding Product Designer
TIMELINE
TEAM
4 Engineers
1 Product Manager
1 UX Researcher
TOOLS
Figma
Claude Design
v0
TL;DR
Merget is a version control system for AI-assisted coding that captures why code was created alongside what changed. As the founding product designer, I owned the end-to-end design of the product, including the core information architecture, Goal Map, collaboration and multi-agent workflows, design system, prototyping, and engineering handoff. I developed a visual model that connects users' goals to the prompts, code changes, collaborators, and AI agents behind them, making complex development history accessible to both technical and non-technical teammates.
PROBLEM
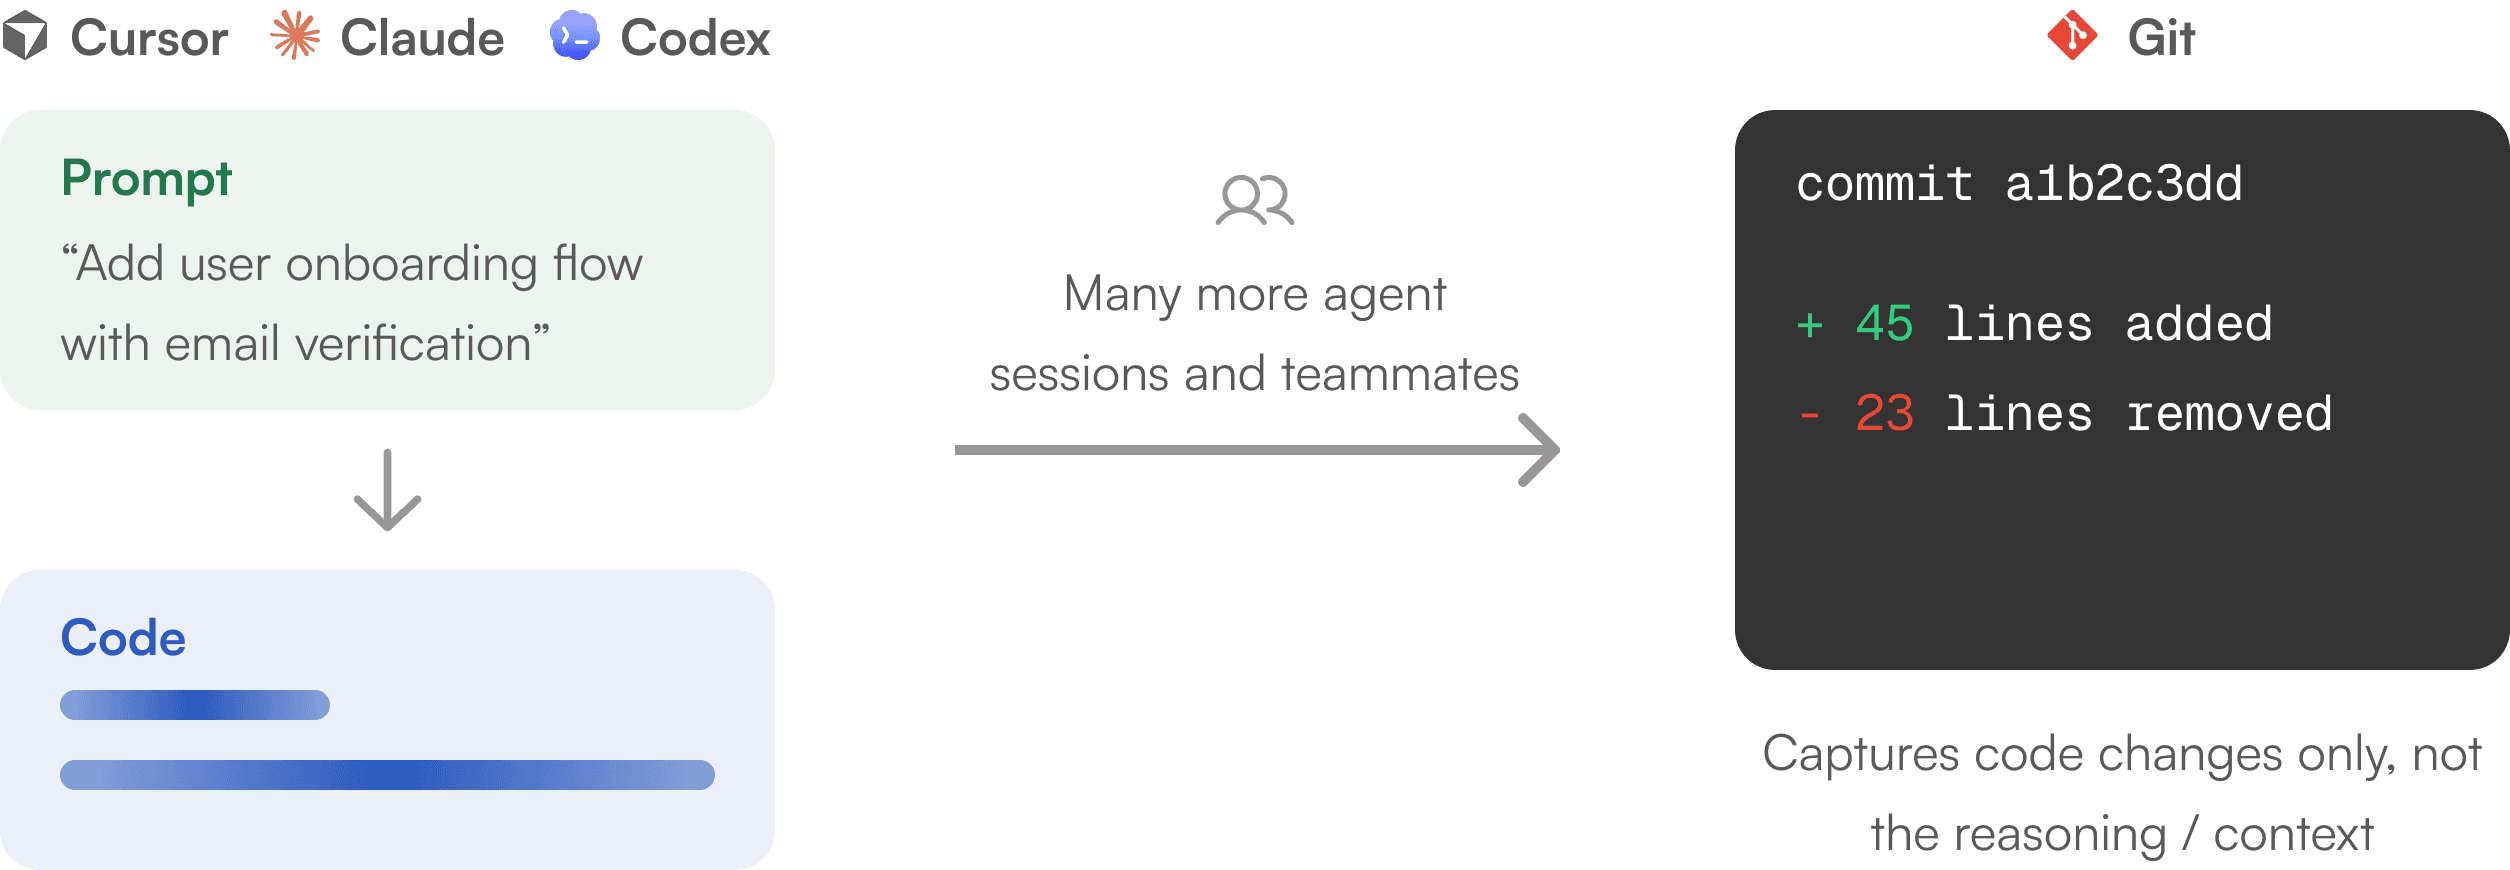
Git was built for a world where humans wrote the code, but now AI wrote most of it.
Git is the tool engineering teams use to track a codebase's history, but it was invented in 2005, when a person coded line by line. Today, a codebase is written across a dozen AI tools, prompts, sessions, and teammates. Yet to Git, a human typing for six hours and an AI agent generating the same code in six seconds look identical: just a code change.
RESEARCH
With AI-assisted coding, developers start with a goal, not prompts.
Through interviews with developers and engineering teams, I found out that AI-assisted development is not a sequence of isolated prompts. A developer doesn't think: I'll send one prompt, get some code, and be done. Instead, they start with a goal, then work toward it through a series of prompts:

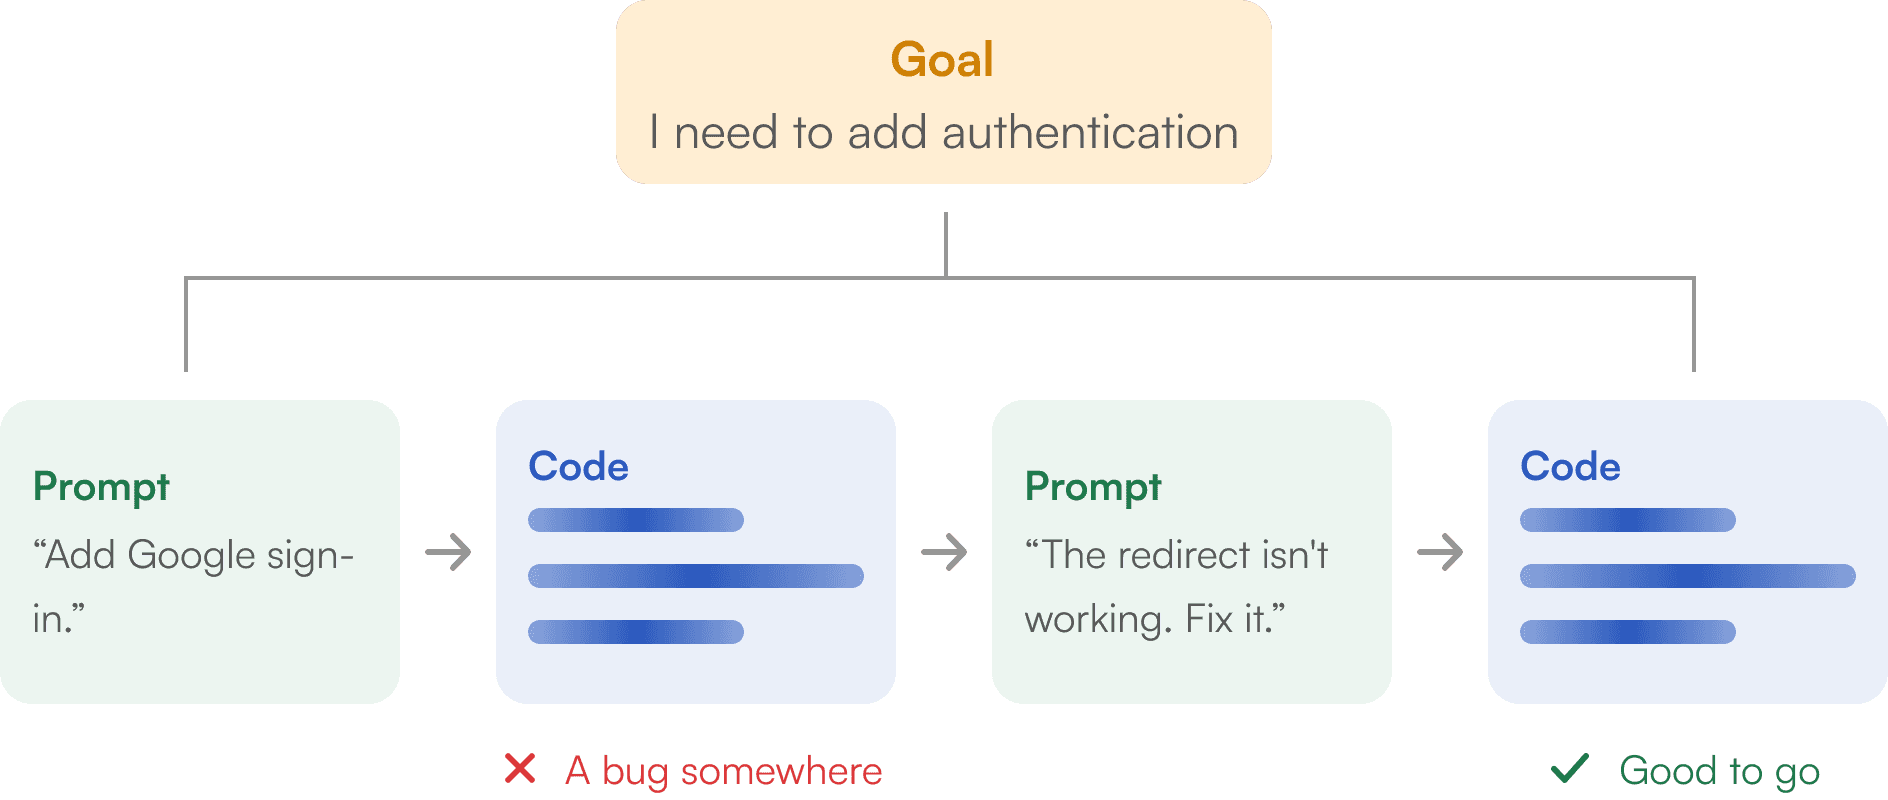

The prompts are different. The code changes are different. But they are all part of the same piece of work: developers hold a goal in mind – a persistent thread of intent that connects the code over time, which Git has no way to represent.

DESIGN DECISIONS & ITERATIONS
How might we visualize the chain of intent?

Iteration I: Goals as a flat table
I started with a straightforward table: one row per goal, with prompt count, steps, and code changes all visible at a glance.

Scannable, fast to parse

Treats each goal as an isolated record
Does not show how goals relate to each other

Iteration II: Node map
I moved from treating goals as rows to treating them as nodes in a connected system, with lines showing the branches and paths.
Structure is visible at a glance
Reflects how AI-assisted development actually happens: work can branch, iterate, and involve multiple contributors along the way
How much information do we show by default?
The node map made relationships visible, but left less room for detail. I needed to cater to users with very different needs. A product manager might only want to know what a team is working on, while an engineer might want to inspect the exact code that changed. I used progressive disclosure to support both.
Default
When a user opens a goal, the details card gives them the context.
Enough to answer "did this happen and roughly how much code changed"
Clicking into a prompt
It reveals the prompt's description, steps, and actual code diff.
Useful for developers


How might we guide users on working on their first code repository?
From analyzing user activity, I found that only 58% of users worked on their first repository. Most created an empty repository and stopped there.
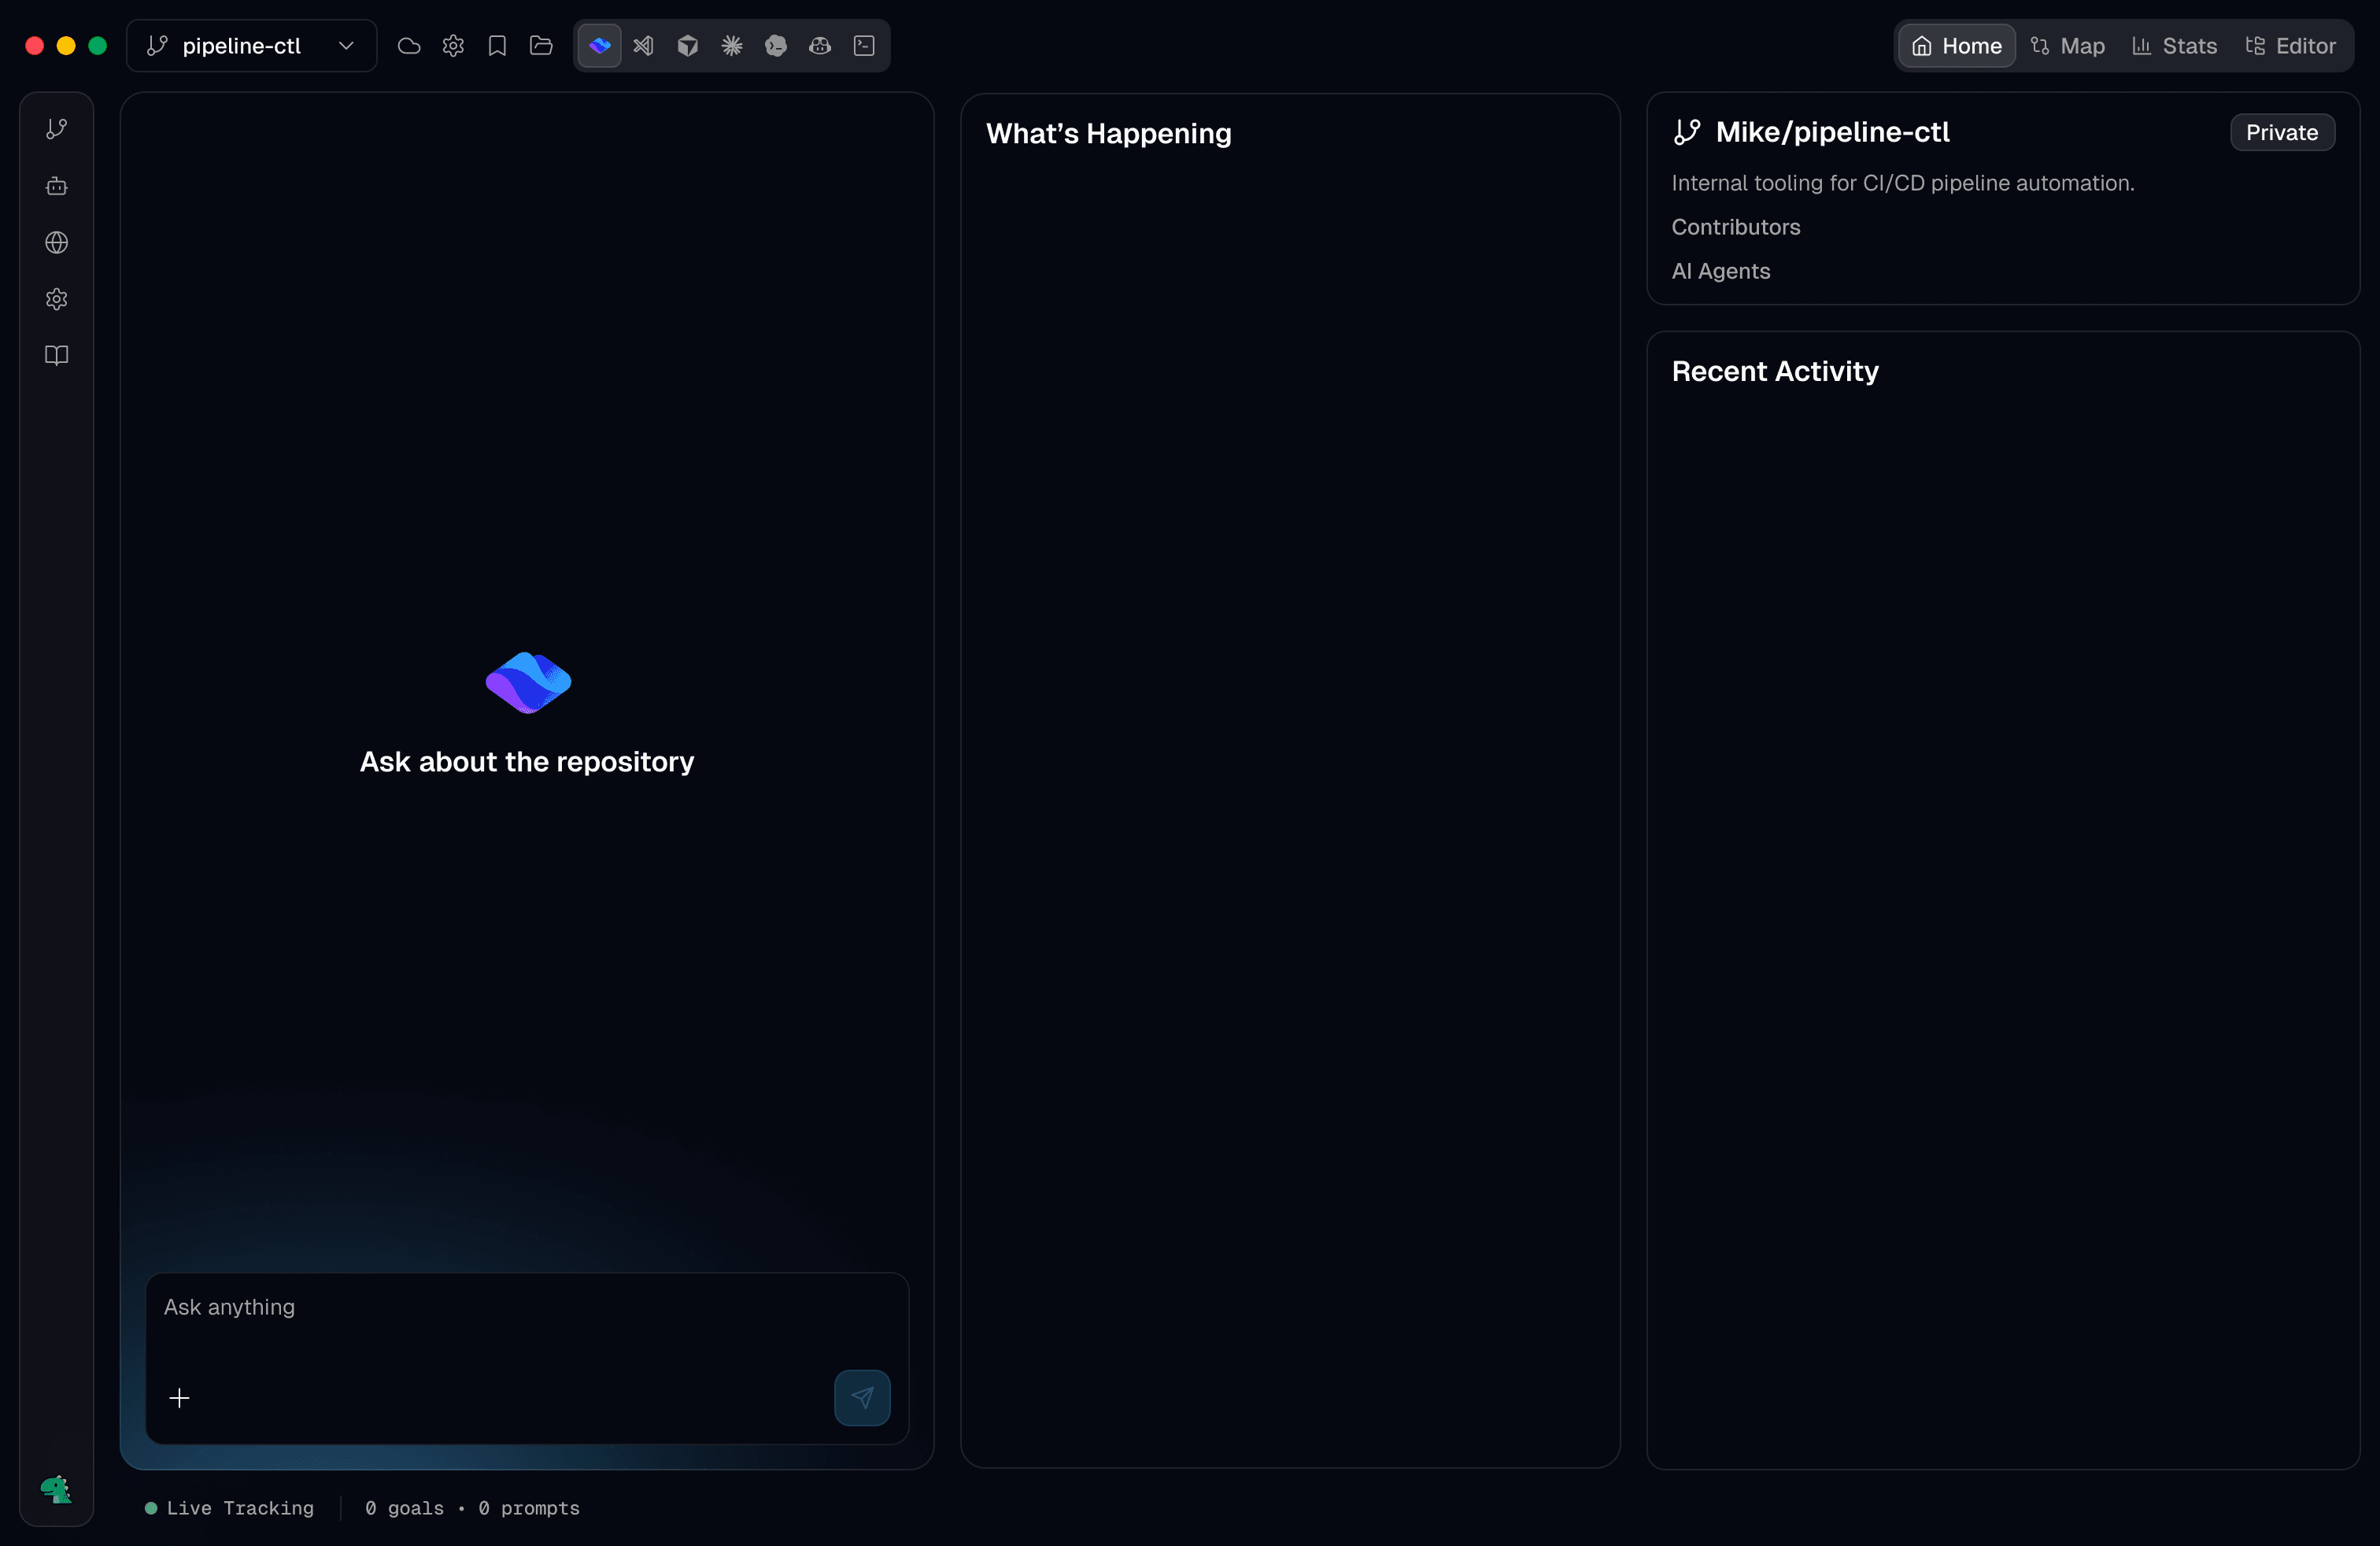
Iteration I: Blank screen
A main reason for the drop-off was that users were dropped into a mostly blank screen with no clear next step.

Iteration II: Suggestions on first steps
I redesigned the empty state around concrete actions: import existing code or connect the coding tool they already use, with the option to skip and explore independently. This gave users a decision they could make in one click.
Repository setup rate increased by 14%

SOLUTION
Merget: Version control system for AI-assisted coding
Transform code history into a visual audit trail of goals
The node map shows every goal as a branching, chronological structure, surfacing how prompts split off, run in parallel, and merge back together. Users can reconstruct how a piece of code came to exist without asking around.
A live feed of what your team and its AI agents are doing
The home screen streams the latest goals and prompts in real time, giving the entire team (engineers or non-technical teammates) a shared view of what's happening now.
Make collaboration visible by showing who's working on what
Avatars appear directly on the Goal Map to show who is actively contributing to each workstream, making ownership and collaboration visible.
Turn AI cost and quality into something teams can audit
Stats surface signals such as token spend and code durability by model, giving teams a way to compare AI-generated work based on what actually happened. This gives teams greater visibility and accountability as AI becomes part of the development process.
Run multiple AI agents without losing the thread
Developers often juggle several AI agents at once, so I designed multiplexing to let them open multiple agent sessions side by side, with prompts streaming in real time. Users can run, compare, and steer workstreams at once while keeping each session's context visible.
HANDOFF
Building a custom design system for consistency and branding
I built the design system on shadcn/ui for components that didn't need reinventing. But the core of the product has no off-the-shelf equivalent: the node map, the branching visualizations, the details card, multiplexing. I built those from scratch and componentized them, ensuring consistency as we scaled.

Vibe-coding microinteractions
For small polish items, I used Claude to prototype, for example, the hover effect on the agent icon bar, where hovering an icon reveals its name inline instead of labeling every icon by default. Describing the interaction to Claude and iterating on the live result let me test timing and easing in minutes instead of a round trip through a formal spec and engineering build.
TAKEAWAYS
Designing for developers = designing for the workflow
Developer tools can be intimidating because the underlying systems are complex. I learned to organize it around the way people actually think and work. This meant starting with a developer's goal and making the technical details available as they became relevant.
The first few minutes decide whether a tool gets used at all
The empty state is often treated as a placeholder, but for a new user, it's the first real interaction with the product. Instead of using onboarding to explain everything, I learned to design the empty state around clear, actionable first steps to help users experience value.
CHECK OUT OTHER PROJECTS: